


Our Main Office
Construction Equipment Guide
470 Maryland Drive
Fort Washington, PA 19034
800-523-2200
Wed August 28, 2019 - Northeast Edition #18
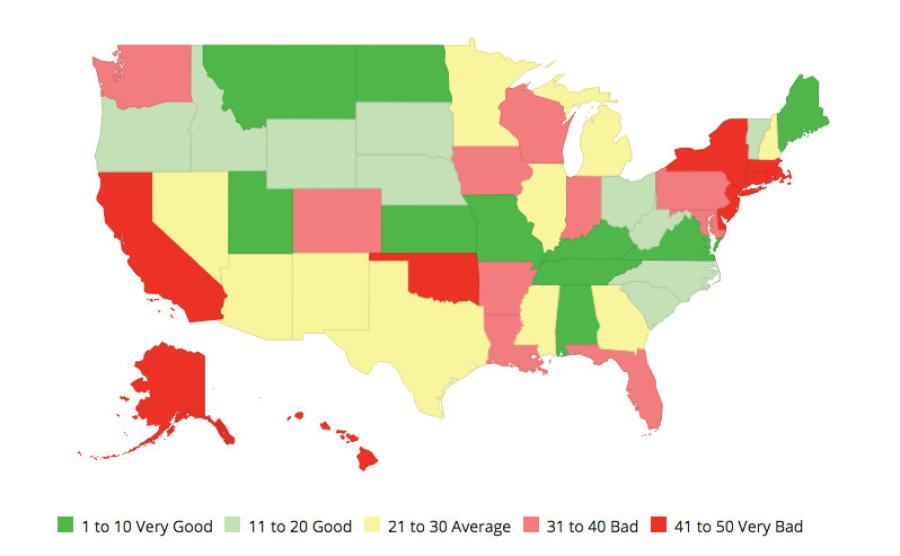
New Hampshire's highway system ranks 24th in the nation in overall cost-effectiveness and condition, according to the Annual Highway Report by Reason Foundation. This is a six-spot increase from the previous report, where New Hampshire ranked 30th overall.
In safety and performance categories, New Hampshire ranks 15th in overall fatality rate, 38th in structurally deficient bridges, 26th in traffic congestion, 7th in urban Interstate pavement condition and 1st in rural Interstate pavement condition.
On spending, New Hampshire ranks 24th in total spending per mile and 22nd in capital and bridge costs per mile.
"To improve in the rankings, New Hampshire needs to reduce its percentage of structurally deficient bridges, decrease its maintenance disbursements per mile and improve its rural arterial pavement condition. New Hampshire is in the bottom 15 for structurally deficient bridges, maintenance disbursements per mile and rural arterial pavement condition.
"Compared to nearby states, the report finds New Hampshire's overall highway performance is better than Connecticut (ranks 44th), Massachusetts (ranks 46th) and New York (ranks 45th)," said Baruch Feigenbaum, lead author of the Annual Highway Report and assistant director of transportation at Reason Foundation. "New Hampshire is doing worse than comparable states such as Maine (ranks 4th) and Vermont (ranks 19th)."
New Hampshire's best rankings are in rural Interstate pavement condition (1st) and urban Interstate pavement condition (7th).
New Hampshire's worst rankings are structurally deficient bridges (38th) and maintenance disbursements per mile (37th).
New Hampshire's state-controlled highway mileage makes it the 45th largest highway system in the country.
Reason Foundation's Annual Highway Report measures the condition and cost-effectiveness of state-controlled highways in 13 categories, including pavement condition, traffic congestion, structurally deficient bridges, traffic fatalities, and spending (capital, maintenance, administrative, overall) per mile.
The Annual Highway Report is based on spending and performance data submitted by state highway agencies to the federal government for 2016 as well as urban congestion data from INRIX and bridge condition data from the Better Roads inventory for 2017. For more details on the calculation of each of the 13 performance measures used in the report, as well as the overall performance measure, please refer to the appendix in the main report. The report's dataset includes Interstate, federal and state roads but not county or local roads. All rankings are based on performance measures that are ratios rather than absolute values: the financial measures are disbursements per mile, the fatality rate is fatalities per 100 million vehicle-miles of travel, the urban congestion measure is the annual delay per auto commuter, and the others are percentages. For example, the state ranking 1st in structurally deficient bridges has the smallest percentage of structurally deficient bridges, not the smallest number of structurally deficient bridges.
Construction Equipment Guide
470 Maryland Drive
Fort Washington, PA 19034
800-523-2200
Construction Equipment Guide covers the nation with its four regional newspapers, offering construction and industry news and information along with new and used construction equipment for sale from dealers in your area. Now we extend those services and information to the internet. Making it as easy as possible to find the news and equipment that you need and want.
Contents Copyrighted 2024, by Construction Equipment Guide, which is a Registered Trademark, registered in the U.S. Patent Office. Registration number 0957323. All rights reserved, nothing may be reprinted or reproduced (including framing) in whole or part without written permission from the publisher. All editorial material, photographs, drawings, letters, and other material will be treated as unconditionally assigned for publication and copyright purposes and are subject to Construction Equipment Guide’s unrestricted right to edit and comment editorially. Contributor articles do not necessarily reflect the policy or opinions of this publication.
Read our privacy policy here.
Mastodon