List Your Equipment  /  Dealer Login

Washington DC Economic Partnership Releases Suite of Development Resources

Wed January 03, 2018 - Northeast Edition #1
Washington DC Economic Partnership (WDCEP)


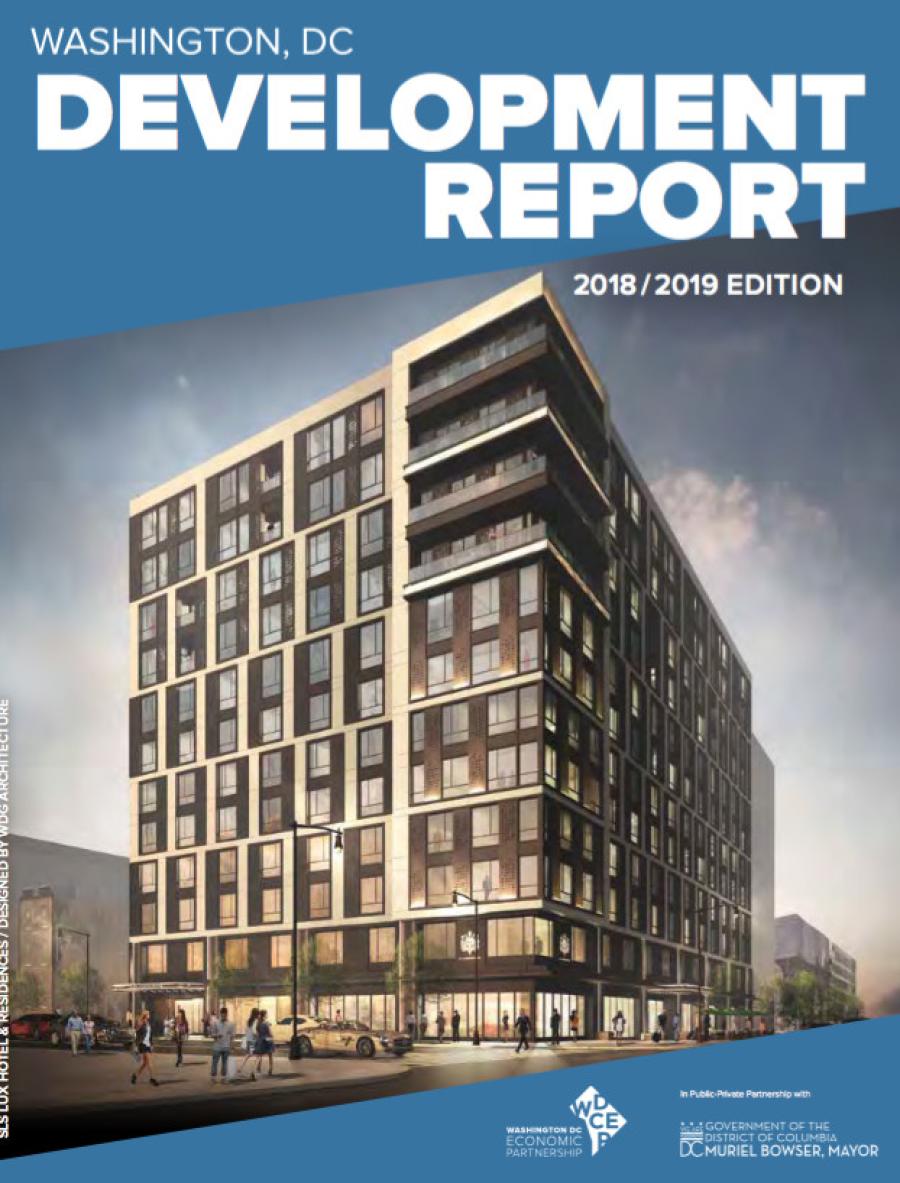
The Washington DC Economic Partnership (WDCEP) has released the latest edition of ITS signature publication, 2018-2019 DC Development Report; an annual summary of approximately 2,000 major development projects in the District of Columbia. This year's report is complemented by a suite of digital resources including the DC Real Estate search tool and mobile app.

Through a public-private partnership with the Office of the Deputy Mayor for Planning and Economic Development (DMPED), this year's suite of resources allows users to query WDCEP's development project database, find pipeline projects in Opportunity Zones, and analyze detailed demographics.

"Through our partnership with WDCEP, the city is able to offer access to an array of data points and resources in order to make informed decisions about future investments that help strengthen our communities," said Brian Kenner, deputy mayor of planning and economic development.

A new section focused on sustainable construction and design was included in this year's report. Developers, including D.C. government agencies, are pushing the envelope on how to incorporate the latest "green" technologies and best practices in health and wellness. The report features eight projects, including the American Geophysical Union's new headquarters, D.C.'s first net zero project, that are leading the way in sustainable development.

"The DC Development Report represents the only consistent synopsis of D.C.'s ever-changing landscape, providing both unique insights into the latest development trends as well as important analysis on future investment opportunities," said Keith J. Sellars, president and CEO of WDCEP.

WDCEP tracks development projects throughout the year, performs an annual "development census" every August, and receives contributions from more than 100 developers, architects, contractors, and economic development organizations that results in updates to more than 400 projects.

This year, WDCEP partnered with Delta Associates to provide insight into D.C.'s economy and various real estate sectors including office, retail, hospitality, and residential.

The Neighborhood Development chapter also has been updated to highlight three areas of D.C.; Capitol Riverfront/Downtown D.C., Mount Vernon Triangle, and NOMA/Union Market, that have undergone tremendous change over the past 15+ years. To document this change aerial photography was used to illustrate the transformation each neighborhood has undergone from 2002 to 2017.

"In order to provide relevant and timely local market intelligence, we have created these tools to allow the real estate and business community to find new opportunities in D.C.," said Chad Shuskey, senior vice president of research and real estate for WDCEP. "This year's report extends our research efforts by showcasing the impact that sustainable development can have on our community."

Highlights from this year's report include:

  • WDCEP estimates total groundbreakings in 2018 will be approximately 10 million sq. ft., in-line with the 10-year average of 10.3 million sq. ft.
  • DC continues to experience record residential construction. As of August 2018, there were 15,600 residential units under construction, including 4,200 units that have already broken ground.
  • WDCEP estimates approximately 6,000 total units will break ground in 2018, a 10 percent decline from 2017, but still above the 10-year annual average of nearly 5,000 unit starts and close to the five-year average of 6,176 unit starts.[1]
  • 7,431 residential units will deliver in 2018 and 7,693 units in 2019 — both significantly above the 10-year trailing average of nearly 4,260 units. 2019 will set a new record for deliveries since WDCEP started tracking this information in 2001, surpassing previous highwater marks in 2014 (6,309), 2017 (7,021) and 2018 (7,431 – projected).[2]
  • DC's 2017 taxable retail & restaurant sales increased by 3 percent from last year to $14.3 billion.[3] Since 2010, sales have increased by 44 percent helping to support the more than 4.8 million sq. ft. of retail and restaurant space that has been built since 2010.
  • DC's average building total energy consumption per square foot (Source EUI) declined by nearly 3 percent from 2014 to 2016 and its greenhouse gas emissions also decreased by 15 percent during the same period.[4]
About DC Development Report

The report can be downloaded from wdcep.com and a new interactive DC Real Estate Search tool allows users to query WDCEP's development project database, find pipeline projects in Opportunity Zones and analyze detailed demographics. The DC Real Estate Search tool is available at http://search.wdcep.com and is available on the Google Play and Apple Appstores.


Today's top stories

North Causeway Bridge Offers Innovation, Congestion Relief for Fort Pierce, Fla., Motorists

Missouri's $284M Chester Bridge Under Construction

Mecalac Offers Telescopic Wheel Loader to Improve Stability, Mobility in Material Handling Applications

Chicago Bears Announce Plans for New Enclosed Stadium

Oshkosh Corporation to Acquire AUSA

Webuild Ready to Rebuild Collapsed Baltimore Bridge

Crews Complete Covington, Georgia Community Project

Alabama AGC Announces BUILDSouth Award Winners


aggregateequipmentguide-logo agriculturalequipmentguide-logo craneequipmentguide-logo forestryequipmentguide-logo truckandtrailerguide-logo
39.96250 \\ -83.00610 \\ Columbus \\ PA